Anomaly Detection Library in Python
Since coming across a number of problems where I needed a simple anomaly detection algorithm I decided to start building out a library containing useful functions for both identifying anomalous data points but also visualising them. I have a couple of blogs explaining the techniques used which I reference below. I have added links to the Github repo as well as a jupyter notebook with example implementation.
Current Project Status
This is a times series anomaly detection algorithm implementation. It is currently focussed on catching multiple anomalies based on your time series data dependent on the confidence level you wish to set.
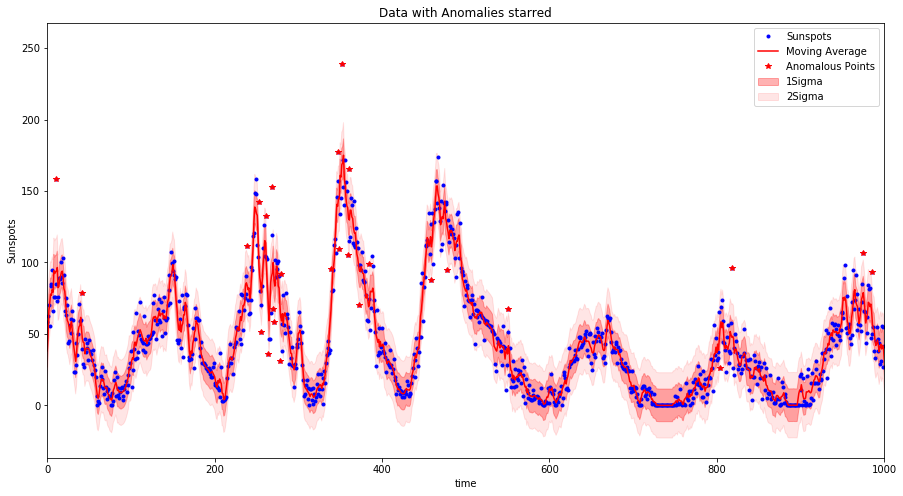
The anom_detect.py can be downloaded and imported, alternatively you can follow the Jupyter notebook to look at an example implementation (links provided above). The result of implementing this method is the generation of plots (shown below) and tables displaying the detected anomalies in your data.
As a general suggestion to anomaly detection is you should to get to know your data. This library is a simple implementation looking to see if the deviation of a point from the trend of the data is explained by the variation of the dataset or not. The selection of the signficance levels is dependent also on your ability to process anomalous points.
Implementation
The algorithm computes a moving average based on a certain window size. The moving average method used implements a simple low pass filter (using discrete linear convolution). This sounds complicated but it is not so bad (I will upload a blog to explain), it is nicer than rolling average methods which don’t deal with boundaries of your data very well (early time data not properly averaged).
Then using the moving average as the trend of the data each points deviation from the moving average is calculated and then the generalized extreme Studentized deviate (ESD) test - an extension of the Grubbs test to multiple anomalies - is used to evaluate the actual data points to identify if they are likely to be anomalous dependent on a user set confidence level (alpha).